Ranking Feature
Comparing Rating Algorithms
by Shannon Wrege, 19 September 2017
| Share: |  |
|  | |
|
|
The 2017 U.S. Open is now in the books, and it was a wild ride - especially for fans of American tennis. During the tournament we posted information on social media about matchups involving American players - previewing matches by displaying rating and ranking differences between the competitors and highlighting wins by underdogs.
One thing you might have noticed in our previews is that the various rating systems usually agree on their predicted winners. For example, all rating systems picked Rafael Nadal as the winner of every match he played. This is obviously not to say that Nadal never loses, but every system would have gotten it wrong if he lost in New York. So whether Nadal wins or loses, either all rating systems get it right - or all get it wrong.
A tournament study we have been conducting for the past three years finds that our TRN ratings, the UTR ratings, and all flavors of point systems (USTA, ITF, ATP, WTA) agree on predicted winners more than 70% of the time. When there is universal agreement like this, the favored player wins more than 80% of the time. (Note that also means lower-rated players win a whopping one out of five times even when every system thinks otherwise!) The remaining 30% of the matches - where there is disagreement over which player is the favorite - are more interesting.

Let’s take a closer look at the 2017 U.S. Open that finished last week. This tournament had 635 singles matches across the men’s, women’s, boys’, and girls’ divisions (main draw and qualifying), and each of the rating systems was correct between 61% and 68% of the time if we consider all the matches. That’s fairly close across the board. The two head-to-head systems, TRN and UTR, were correct 68% and 66% of the time, respectively. That’s really close, but if we ignore the matches where they agree, the picture looks different.
A good way to visualize the differences is with Venn diagrams. In each diagram below, the circles represents matches from the tournament, and the overlapping region shows the matches where the algorithms agree on the favored player. The percentages indicate how often the higher rated player wins.
Let’s start by taking the systems two at a time, breaking things down for each pair.
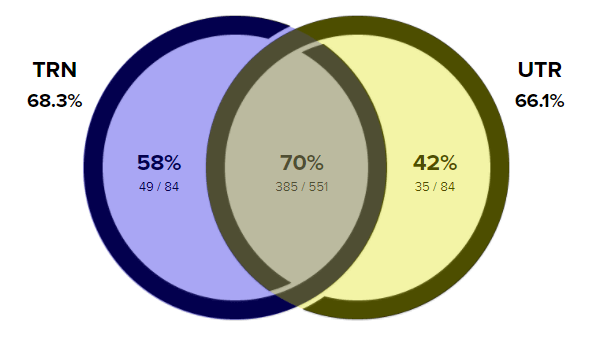
TRN and UTR
How often do the different rating systems correctly predict the winners of matches?
The overlapping region of the figure shows that TRN and UTR agree on their choice of favorite in 551 of the 635 matches (87% of the time). In the 84 remaining matches where they disagree, the higher-rated TRN player won 49 times and the player with the higher UTR won 35 times. A 14-match difference may not look all that big when you are looking at 635 matches, but it looks quite a bit larger if you are just looking at 84 matches. When TRN and UTR picked different winners, the TRN favorite was 40% more likely to win (49/35 = 1.40).
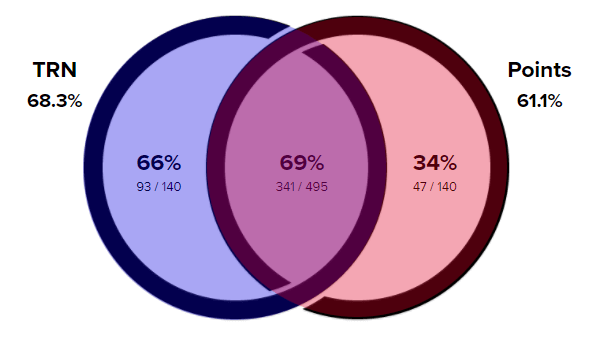
TRN and Point Systems (ITF, ATP, and WTA)
How often do the different rating systems correctly predict the winners of matches?
Similarly, TRN and the various points systems agree on the favorite 78% of the time (495 of the 635 matches). In the 140 matches where this is not the case, the player with the higher TRN rating won almost twice as often as the player with more points (93/47 = 1.98).
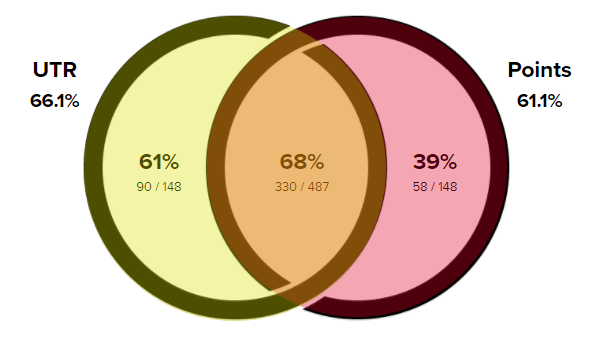
UTR and Point Systems (ITF, ATP, and WTA)
How often do the different rating systems correctly predict the winners of matches?
The UTR and the points systems also agree frequently - 77% of the time (487 of the 635 matches). When they disagree, the player with the higher UTR won 55% more often than the player with more points (90/58 = 1.55).
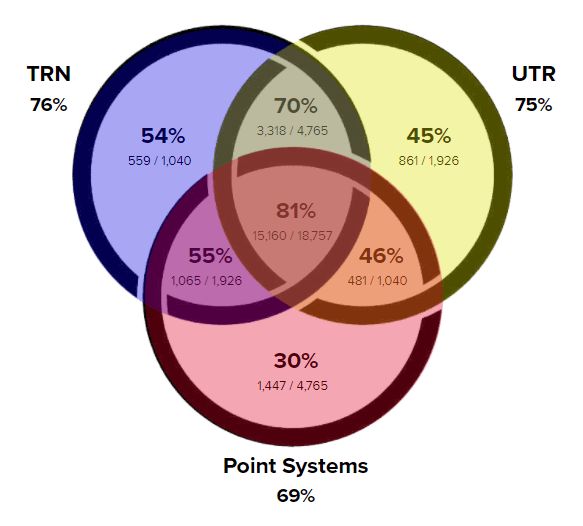
All the Systems Combined
These 2-circle Venn diagrams can be combined into a 3-circle diagram that shows the entire picture.
How often do the different rating systems correctly predict the winners of matches?
Each of the three circles is divided into four regions: one region where the algorithm agrees with both of the other systems about the favorites, two regions where the algorithm agrees with one of the other systems, and one region where the algorithm is the lone wolf - choosing a favorite that differs from both other systems.
As expected, the very center region - where all of the algorithms agree on the favorites - has the highest overall win percentage at 70%. One would expect that the next-highest percentages would come in the three regions where there is agreement between two of the three systems, but that is not the case.
Note that TRN is the only system where the higher-rated player wins more than half the time in all four of its regions. Even when it disagrees with both other systems, it chooses the correct winner more often than not. Furthermore, the only times the other systems choose the correct winner more than 50% of the time is when they agree with TRN.
The Big Picture
There were hundreds of singles results from the 2017 U.S. Open, but it could be that TRN got lucky in this one tournament. It’s easy to point out anecdotes at the match level, but is this tournament just an anecdote? To best answer the question we can broaden the scope to include all of the matches from all the tournaments we studied over the past three years (almost 26,500 matches as of publication date). When we do, we find that things look pretty similar:
How often do the different rating systems correctly predict the winners of matches?
If we order the seven regions of the diagram above by percentage of the time the favored player player won, TRN is in each of the top four groups:
| Region | Wins
Predicted | Rating Systems |
| 1 | 81% | TRN | UTR | Points |
| 2 | 70% | TRN | UTR | |
| 3 | 55% | TRN | | Points |
| 4 | 54% | TRN | | |
| 5 | 46% | | UTR | Points |
| 6 | 45% | | UTR | |
| 7 | 30% | | | Points |
These numbers illustrate why even though TRN predicts the actual winner only a few percentage points more than the other systems overall, we tend to do it consistently in almost every tournament we have examined.
As we have discussed before, we find value in having many different rating systems, and some of the ideas presented in this article offer one more reason why. Not only is each rating system designed to answer a different question, but we have now observed that every system becomes more predictive when it agrees with one of the other systems and most predictive when it agrees with both of the other systems (even if predictability is not the algorithm’s goal). By having multiple systems, we can benefit from the wisdom of crowds rather than depending on the opinion of any single system. This can help us to identify the more interesting matchups to watch, and it can identify the biggest upsets when a player outperforms all the different systems’ expectations.
Leave a Comment
More Ranking Articles
13-Jul-2016
Behind the Tennis Recruiting Rankings
This week marks the 569th consecutive week that Tennis Recruiting has
put out graduation-based rankings of American junior boys and girls.
Rankings are front and center on Tennis Recruiting, and people often ask
us how our rankings work. Today we describe our ranking system ...
19-May-2016
What Is An Upset?
Tennis Recruiting is a website that rates and ranks junior tennis
players. One of the questions we get most often from our users is,
"What exactly is an upset?" There are many possible
definitions of an upset - this article explores the question and
puts forward an answer.
5-Oct-2015
An Overview of Ratings and Rankings
Tennis Recruiting is a website that rates and ranks junior tennis
players, and because of that, we field many questions about how to
interpret our lists. Questions like, "Are rankings better than
ratings? Which is more important?" Or, "Since your system
ranks by graduation year, are you able to compare players from
different classes?" This article addresses the simple distinction
between ratings and rankings.


 The lifeblood of Tennis Recruiting is its rankings - and our team has been ranking tennis players for more than two decades. Learn about tennis rankings in general - as well as our best-of-breed ranking system.